Rumpus Mobile Console
The Rumpus mobile console app for iOS allows Rumpus administrators to monitor, review, and even perform limited server administration from an iPhone or iPad. Use the app locally or remotely to view current activity, recent uploads, or manage user accounts. Download the app from the iOS App Store.
- Logging In
- When the Rumpus console app is first launched, you'll need to supply at least 3 pieces of information: the server address, your administration account username, and your password. You can optionally supply an external server name so that you can monitor your server when not on the same local network.
- Important Note About Server Connections:When making a local connection on the same network as the server, the Rumpus mobile app uses the HTTP service for all communication with the server. Since local connections do not take place across the public Internet encryption is not necessary, but when remotely connecting, the Rumpus app always connects via HTTPS to ensure security of your session.
- Local Address
- Specify the local IP address of the server. The Rumpus console app will communicate with the server locally via HTTP, so if your Rumpus HTTP service is run on a non-standard port, include the port number after the LAN IP address of the server, separated by a colon.
- External Address
- Enter the domain name commonly used to access your server from outside your network via HTTPS. If a non-standard port is used for HTTPS access (any port other than 443), include the port number after the server name, separated by a colon.
- Admin Name
- Supply your administrative user account name.
- Admin Password
- Supply your administrative user account password.
- Remember Password
- For better security, it is generally best not to have the Rumpus mobile console record your Rumpus user account password, so in most cases, we recommend leaving this option off. In this case, each time you launch the Rumpus app, you'll be prompted to supply the password in order to use any of the console app's functions. However, as a convenience for administrators who manage Rumpus servers with low security requirements, you may choose to have your account password saved, simplifying the connection process when the Rumpus app is first launched.
- Refresh Rate
- This slider allows you to adjust how frequently the app accesses the server to update status displays. When using the app for relatively short periods of time or to view activity in real time, slide left. If you leave the Rumpus console app running more often and only occasionally check the monitor, you can reduce network traffic and server load by sliding right.
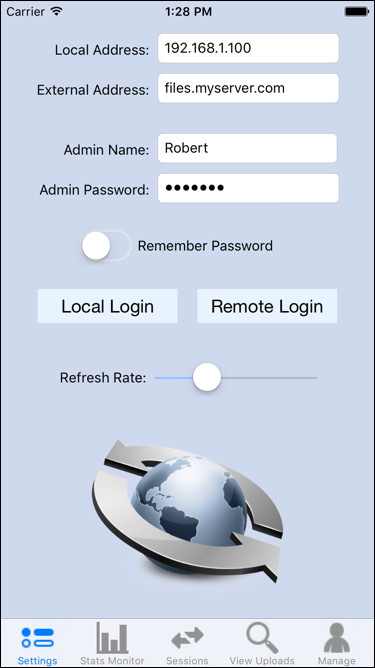
To connect to the server and begin a session, click either the "Local Login" or the "Remote Login" button, depending on whether your device is currently on the same local network as the server, or connected via the Internet. Once connected, there are four primary functions available for monitoring and managing the server, selectable using the tabs bar at the bottom of the screen.
- Statistics Monitor
-
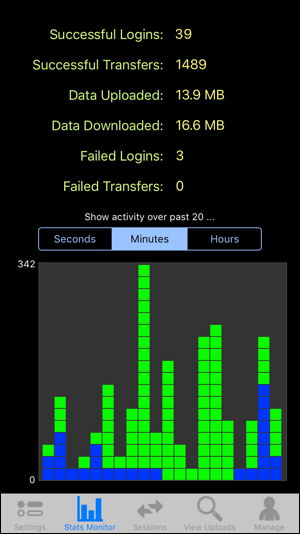
The stats monitor represents a high-level view of past and current server activity. Successful logins, transfers, data uploaded and downloaded, etc. are reported since the last service restart, or for that day if the "Reset Server Statistics Nightly" option (on the Network Settings window, Preferences tab in the Rumpus server control application) is enabled.
The activity graph reflects recent FTP (blue blocks) and Web (green blocks) over the past 20 seconds, 20 minutes, or 20 hours, at your selection.
The graph is relative and the view is based on the number of FTP commands issued and the number of HTTP requests received. In other words, it is not an accurate representation of the amount of data transferred or even the overall load on the server. For example, a large FTP upload may be done with a single command, and so in the graph will appear to have the same weight as the display of a single icon in the Web interface. So, while it can't be relied on for rigorous analytics, the graph is a good general indication of recent server activity and user access.
- Active User Sessions
-
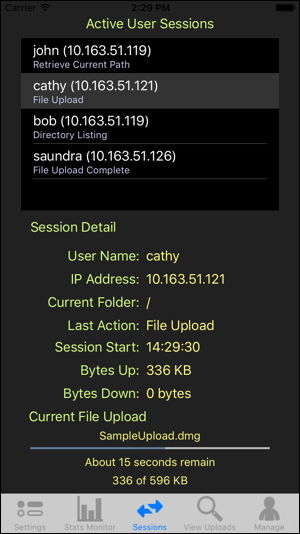
The Active User Sessions tab, as it's name implies, displays all currently active user sessions, as well as detail about any one selected session.
At the top of the screen is a scrollable list of the active sessions, with each entry shown with the user account name, their client IP address, and the most recent action taken in the session. Select any session to update the lower portion of the screen, which provides details about that session.
The session detail information shown is fairly self-explanatory. In the screen shot at right, you can see that "Cathy" is currently logged in and is actively uploading a file named "SampleUpload.dmg" into her Home Folder (the "Current Folder" field is "/").
- Recently Uploaded Files
-
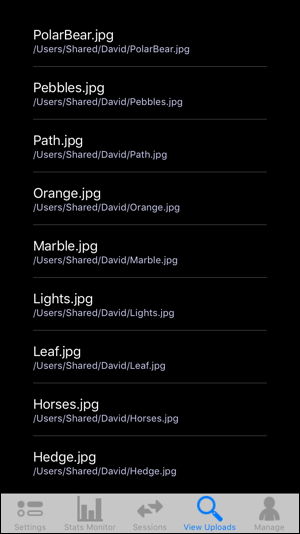
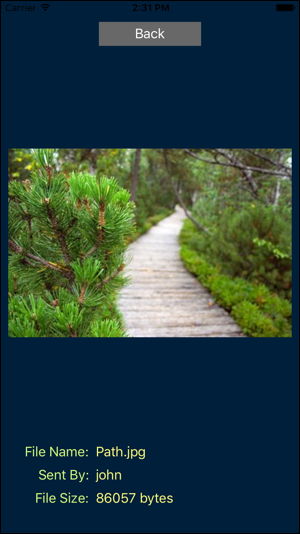
The Recently Uploaded Files tab displays a scrollable list of files recently uploaded to the server. Tap on any file entry in the list to view detail on the file, including a preview image of the file contents, if possible.
- Manage User Accounts
-
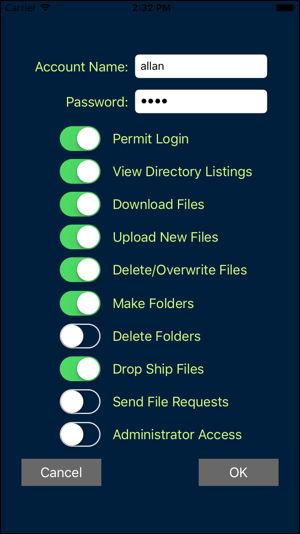
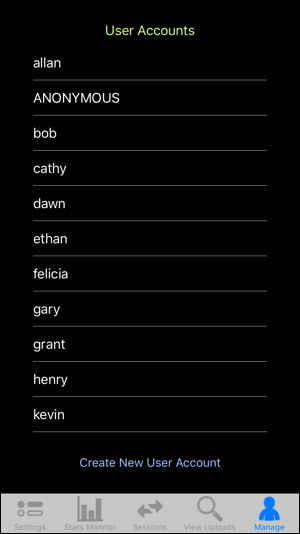
User accounts that are viewable and editable by the administrator using the Rumpus Mobile Console are displayed in a list of accounts. Selecting any account opens the user account detail view, where basic user access privileges can be adjusted if necessary.
The functionality of the user account detail view will depend on how the Rumpus server is configured. These configuration options can be found on the Network Settings window, Remote Admin -> Mobile App tab in the Rumpus control application. For details, see the "Remote Administration" article in the Rumpus package.
